Data Visualization in Prime 16
Using Prime to Manage Your Office
Managing a legal aid office is a complex job. Case Management holds the key to understanding what is happening, but sometimes it is difficult and time consuming to glean information out of stacks of numbers.
That is the purpose of the Business Intelligence Dashboard built into Prime 16. It takes vast quantities of data and turns them into useful information. Regardless of your perspective; project director, litigation coordinator, managing attorney, private bar coordinator, or individual advocate, these graphs can help you to better understand your program, office and caseload.
If you already use the data in Prime for decision-making, the dashboard will make your job easier. If you don’t currently use the information in your case management, the Business Intelligence Dashboard will provide you with exciting new insights into the services you provide.
Get the information you need faster, easier and in a format that you can quickly understand. Spot trends and red flags before they become problems.
Easy to Use
All the graphs are provided for you. Enter any parameters, such as a date and office number, and then click to see the graphs you want. You can change the parameters with a push of a button to get a different view of the information you need.
Compare Data to Information
The usefulness of this approach is easy to demonstrate. If we compare monthly data:
With the information provided by the dashboard, the difference is striking.
What Tools are Provided with the Business Intelligence Dashboard?
Prime provides over 75 graphs that show you the services you are providing and who you are helping. These are already set up to allow you to examine your program delivery. However, fixed graphs are never useful since there is always the desire to be able to look at the data from different perspectives. That’s why the graphs can be modified by nine different criteria. These include:
Dates Office Unit
Staff Number Problem Code Reason Closed
County Funding Code Case Type
The dashboard also lets you look at different parts of your delivery. Graphs are provided for:
Open Cases Closed Cases
Eligibility Slips Time Keeping
Callbacks Private Bar Delivery
Outcomes
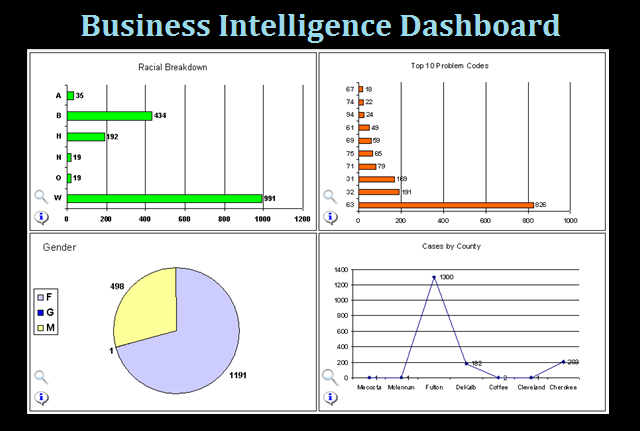
Graphs are displayed two or four per page. They can be zoomed to show a single graph on the page. Clicking the “i” information button pops up a legend explaining the problem codes, funding codes, staff numbers, etc. If you also want the figures upon which the graphs are based, another button provides this information.
Some graphs provide overlays of multiple years so you can compare what you did last year with what is happening this year.
You can also see what problem codes, case types, etc. occur most frequently
Like the rest of Prime, nothing is locked. You can go into the graphs and modify the way they look and the information they provide. We can build additional graphs that cover specific needs or you can construct them yourself.
Contact us for a demonstration or further information. The Business Intelligence Dashboard is just one of a wide range of improvements you’ll find in Prime 16.2.02.